Financial key performance indicators (KPIs) don’t tell the real story about the financial condition of your company. Last month I wrote about your current ratio, the first of three liquidity ratios. Liquidity ratios tell you whether you can pay your bills and whether your company is building inventory. This month I’ll write about the acid test, or quick ratio, which is the second of three liquidity ratios.
The acid test was devised because many companies have too many of their current assets tied up in inventory. It answers the question, “Can your company still pay its bills if inventory is taken out of the equation?”
The acid test is calculated by subtracting inventory from current assets and dividing the result by current liabilities. For this ratio to be accurate, your inventory must be accurate. Many times I see inventory at the same value each month on your balance sheet. This scenario isn’t likely. Since materials are used every month, inventory should change every month. Counting inventory once per year is critical. However, that isn’t the only time that inventory should change on your balance sheet. Inventory is a bet. Your acid test helps monitor whether you are making good bets.
Like the current ratio, the acid test trends are important. For the acid test, 99% of the time, an increasing acid test means increasing profitability. A decreasing acid test means decreasing profitability. Lower profitability means soon you will experience a cash flow problem, a productivity problem, or another profitability problem.
Like the current ratio, the other 1% of the time, your acid test decreases because you purchased or sold assets. If you purchase a truck for cash, you are trading short-term assets (i.e., cash) for long-term assets (i.e., a vehicle). Assuming that your current liabilities stay the same, your acid test will decrease because you have less cash for operations, and as a result, you’d have a smaller acid test ratio than you would have if you leased the vehicle. If you purchased the truck on payments, your current ratio will also decrease because you have an increase in liabilities (i.e., a truck payment) for the same current assets.
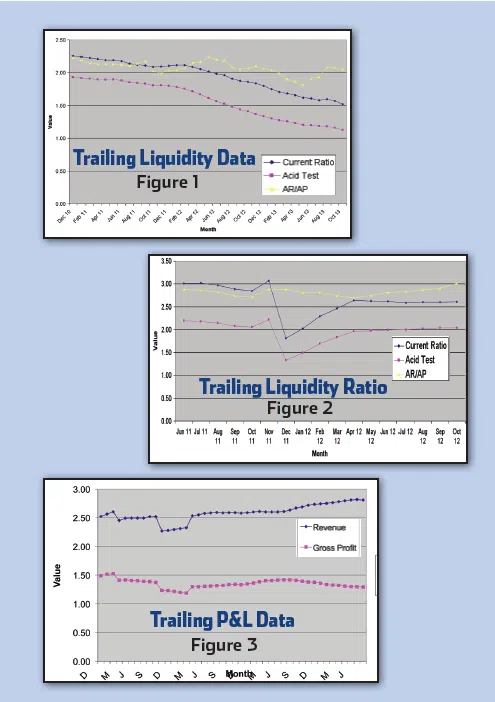
The best way to look at the trends is to plot the ratios. Figure 1 shows the trailing ratio or long-term view. This contractor is losing profitability because his current ratio and his acid test are decreasing on a long-term basis. He must take action to bring his company back to profitability.
Also look at the space between the current ratio and the acid test lines in Figure 1. The lines are parallel, which means that the contractor is not building inventory reserves. He is using a consistent amount of inventory for the work that he is doing.
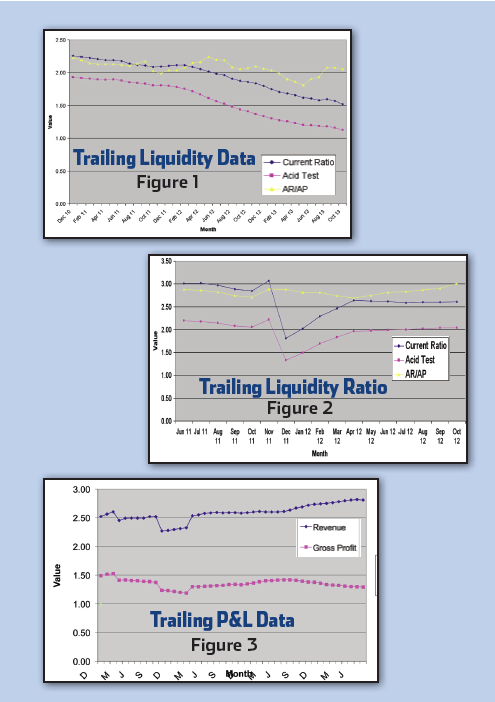
Figure 2 is the trailing ratio graph for a contractor where the owner spent cash at the end of his fiscal year. That is, he traded current ratio assets (cash) for long-term ratio assets (trucks and equipment). You can tell when the cash spending occurred by looking at the huge dip in the current ratio and the acid test. Like Figure 1, the lines between the current ratio and the acid test are parallel. He is not buying too much inventory for the revenues produced.
Figure 3 is the trailing ratio graph for a contractor who is building inventory. For the first part of the graph, the contractor isn’t buying more inventory than he is using because the lines are parallel. In the second part of the graph, the current ratio and acid test lines are spreading. This means the contractor is buying more inventory than he is using. This is a warning sign to stop buying inventory and use what is on hand.
Once you look at the shape of the graphs (i.e., parallel or spreading), look at the distance between the current ratio and the acid test lines. The acid test values should be more than half of the current ratio values. This is the case in Figures 1 and 2. Figure 3 shows the acid test at less than half of the current ratio toward the end of the graph. Not only has the company built inventory, it now has too much inventory on hand.
Next month I’ll discuss the last liquidity ratio, your accounts receivable to accounts payable ratio.
Ruth King has over 25 years of experience in the hvacr industry and has worked with contractors, distributors, and manufacturers to help grow their companies and become more profitable. She is president of HVAC Channel TV and holds a Class II (unrestricted) contractors license in Georgia. Ruth has written two books: The Ugly Truth About Small Business and The Ugly Truth About Managing People. Contact Ruth at ruthking@hvacchannel.tv or 770.729.0258.

It’s all about negative accounts payable and negative credit cards payable.
Get the Insider Take on Mistake No. 6, Negative Accounts Receivable and Mistake No. 7 Negative Inventory.
Never Forget the Dangers of Negative Cash.

Explore Part 4 of the most common financial mistakes.

The mistakes to avoid when selling your business.