Several years ago we were in the process of launching an Internet-based product. It was fairly complex and a bit ahead of its time. We were wrestling with how to introduce it throughout many levels of the company. Then one of my colleagues introduced me to the Ishikawa Diagram — or fishbone diagram.
Professor Kaoru Ishikawa, a Japanese quality control statistician, originally developed the fishbone diagram. Ishikawa pioneered quality management processes in the Kawasaki shipyards. He developed the diagram to assist teams in categorizing the many potential causes of problems in order to identify root causes.
I have found the fishbone diagram to be an excellent management tool. It makes managers think about a process and all of the contributing factors ending in the result — good and bad.
With slight alterations, you can use the model for almost anything within your company, such as policies, procedures, human resources, identifying customers, technology management, overall company business plans, marketing, advertising, sales, service, and project management. Individuals or teams can use the fishbone diagram.
My favorite use of the diagram is business planning. In this month's article "Calling All Customers," Susan Hart begins the first of her two-part series on outbound call centers: how to plan them, what makes them successful, etc. You can use the fishbone diagrams to tackle a basic problem.
Put the name of a basic problem at the right of the diagram at the end of the main "bone." The main possible causes of the problem (the effect) are drawn as bones off of the main backbone.
The key is to have four to six main categories that encompass possible influences, then "bones" are added as long as the problem areas can be further subdivided. When the fishbone is complete, you have a picture of all of the possibilities of the root cause for the designated problem.
-Place the main problem under investigation in a box on the right.
- Draw four to six bones off the spine. These will be your process variables. Place them into naturally related groups. The labels of these groups are the names for the major bones on the Ishikawa diagram.
- Combine each bone in turn, ensuring that the process variables are specific, measurable, and controllable. If they are not, branch or "explode" the process variables until the ends of the branches are specific, measurable, and controllable.
Tips:
- Take care to identify causes rather than symptoms.
- Post diagrams to stimulate thinking and get input from other staff. Sources of variation can be rearranged to reflect appropriate categories with minimal rework.
- Ensure that the ideas placed on the Ishikawa diagram are process variables, not specially caused other problems such as tampering, etc.
- Review the quick fixes and rephrase them, if possible, so that they are process variables.
- Click here to access the fishbone diagram template that you can download and put to use. 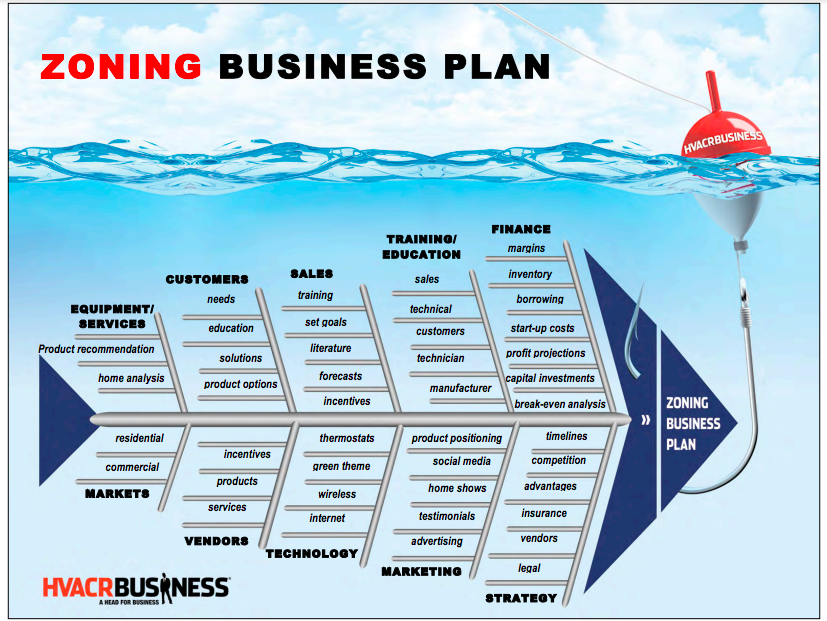

It’s a time for change that can signal an opportunity for the future.

Publisher Terry Tanker spoke with Jeff Underwood, President of RectorSeal. The two discussed living in Texas, family, selecting a management team and introducing new products.

The details that make branding work. Think of branding as long-term success.

Micromanagement is a prevalent issue in many workplaces, yet few are willing to openly address it.

They discussed how to introduce students, educators and parents to the plumbing, heating, cooling and electrical trades. And how contractors, distributors and manufacturers can support the effort.