Finance
Ruth King explains the importance of trailing data when analyzing profit and loss
If you only look at the monthly profit and loss statement without analyzing the report, you might get lulled into a false sense of security. Monthly data and year-to-date data reports on a profit and loss statement don’t tell the whole story.
Graphing the Financial Data
Most business owners receive monthly data and sometimes year-to-date data. If you look at these two reports in numbers, you cannot see the revenue, expense, and profit trends. Only by graphing the data, can you see all that is going on with your business on a long-term basis. Then, you can spot the minor issues and take care of them before they become major crises.
By looking at both the monthly graphs and the trailing graphs you can see what is happening with revenues, gross profit, gross margin, overhead, and net operating profit.
Revenue vs. Sales
First, make sure your profit and loss statement, is reporting revenues, not sales.
What’s the difference?
Sales are just that – sales. What did you sell? It doesn’t matter whether you have done the work.
Revenues are what you billed/collected for the month.
For example, you could sell a $1,000,000 project. That’s the sale. However, it is unlikely that you will sell and complete that project in a month. If you do, then sales equal revenues. Most likely you will complete a piece of the project each month and bill the customer accordingly.
The revenues are what you bill each month. So, if your company sold a $1,000,000 project and it was going to be completed in four months, the revenues each month would be $250,000. The revenues are what you report on your profit and loss statement…not the sale.
Then, take the data from your monthly profit and loss statement and create two graphs: a monthly data graph and a trailing data graph.
The monthly data graph of your profit and loss statement takes the values directly from the monthly profit and loss statement. Each month represented in the spreadsheet is the exact data that is reported on your profit and loss statement.
Trailing data looks at a year’s worth of data one month at a time. It is calculated by adding 12 months of data and dividing it by 12 to get the month’s data point. For example, the revenue data point for January 2022, is calculated by adding the revenues from February 2021 through January 2022 and dividing the result by 12. You can do trailing data by week (divide by 52) or even by quarter. However, analyzing data monthly is sufficient. Trailing data is typically calculated monthly and considered enough for analysis purposes. However, trailing data needs at least 14 months of data to create an accurate graph.
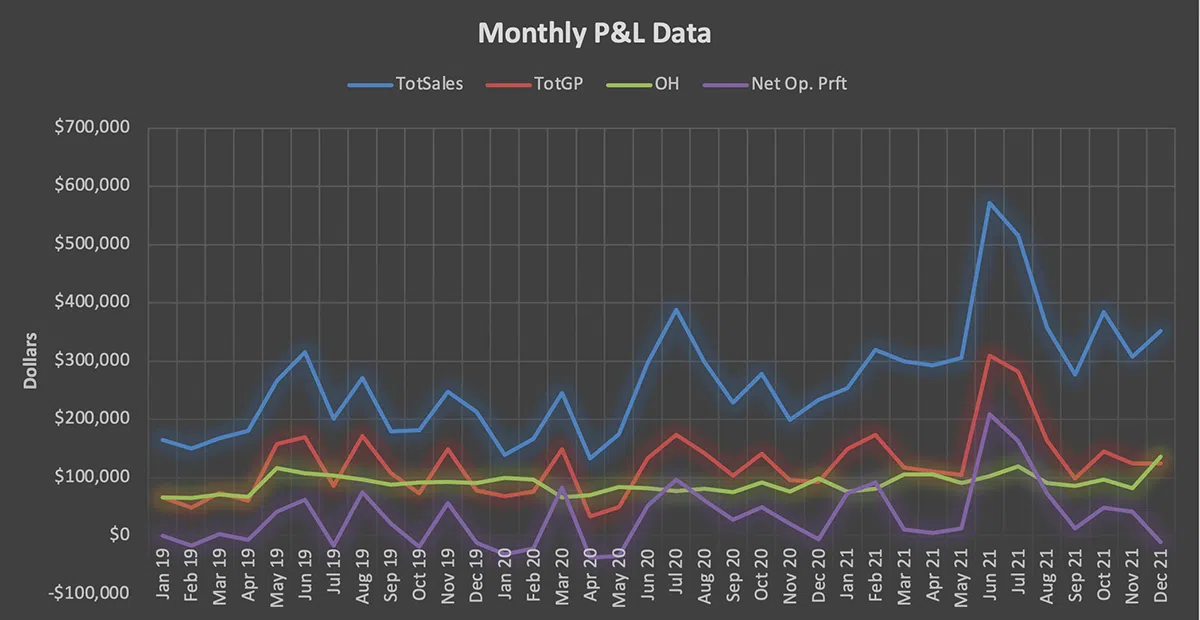
Here are the monthly P&L and trailing data graphs for a contractor: 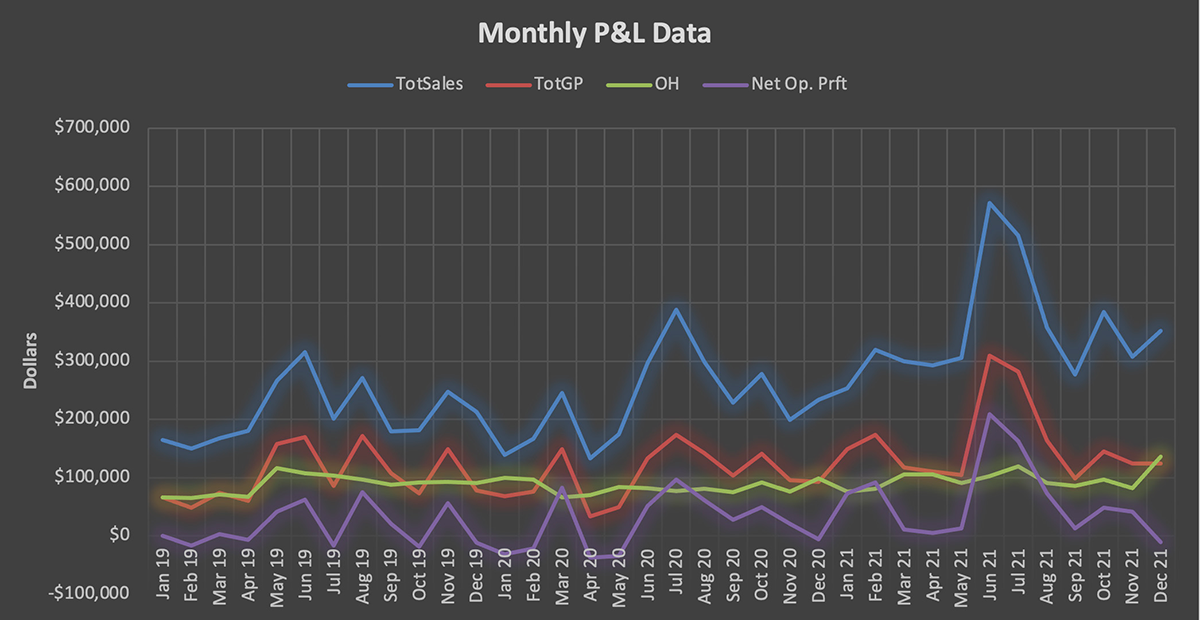
Monthly P&L Data Graph vs. Trailing Data Graph
It’s hard to see the condition of the company by viewing only the monthly P&L data graph because of seasonality. Revenues, gross profit, and net operating profits are going up and down. The only constant line is overhead – and overhead should be constant. To accurately determine whether the company is headed in the right direction, look at the trailing data graph as well.
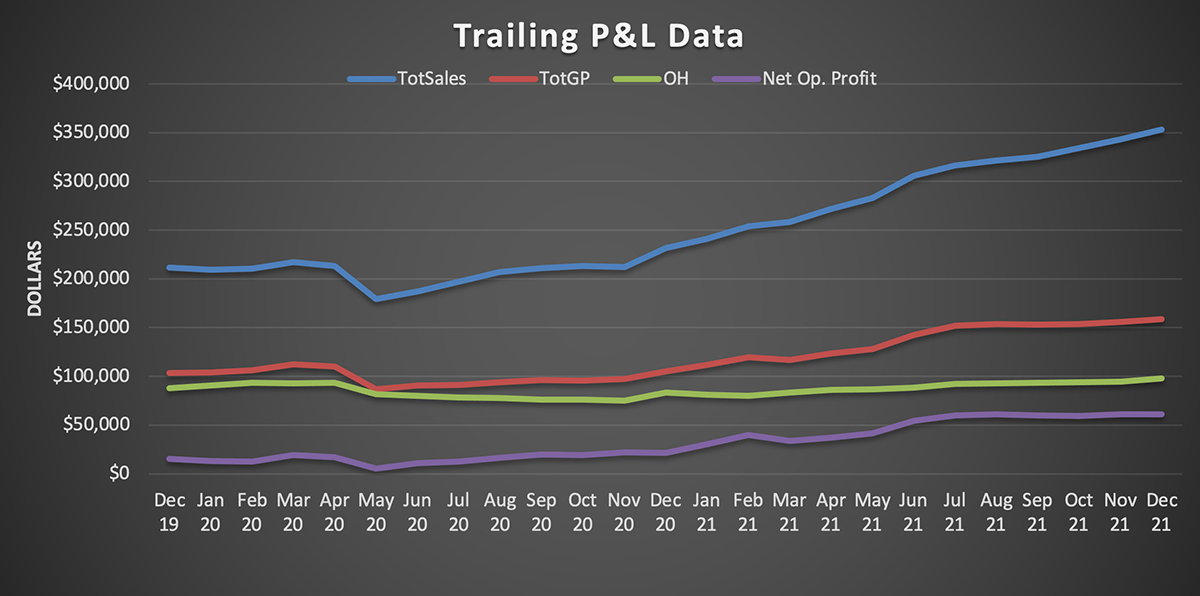
The most important line in the graph is net operating profit. The graph shows in this example, that on a long-term basis, profits are increasing.
The warning sign is that revenues are increasing faster than gross profit. The revenue and gross profit lines are parallel when gross margins are consistent. This graph shows that the company is doing more work at lower gross margins. Pricing may need to be increased because costs have gone up. Or the jobs are taking longer than the bid number of hours, which means that productivity is decreasing.
If you learn how to analyze your own company story, you will be better equipped to fix issues early and succeed in the long term.

Review Timely, Accurate Financial Statements Each Month

Tracking Profitable Billable Hours Each Month

King provides counsel on what to do when your overhead is too high.

Determine overhead costs for your HVAC business

How to get your field service business financially fit